

Summary
The Summary tab is a snapshot of one visitor over the date range you picked. It is split into blocks, and each block answers a different question.
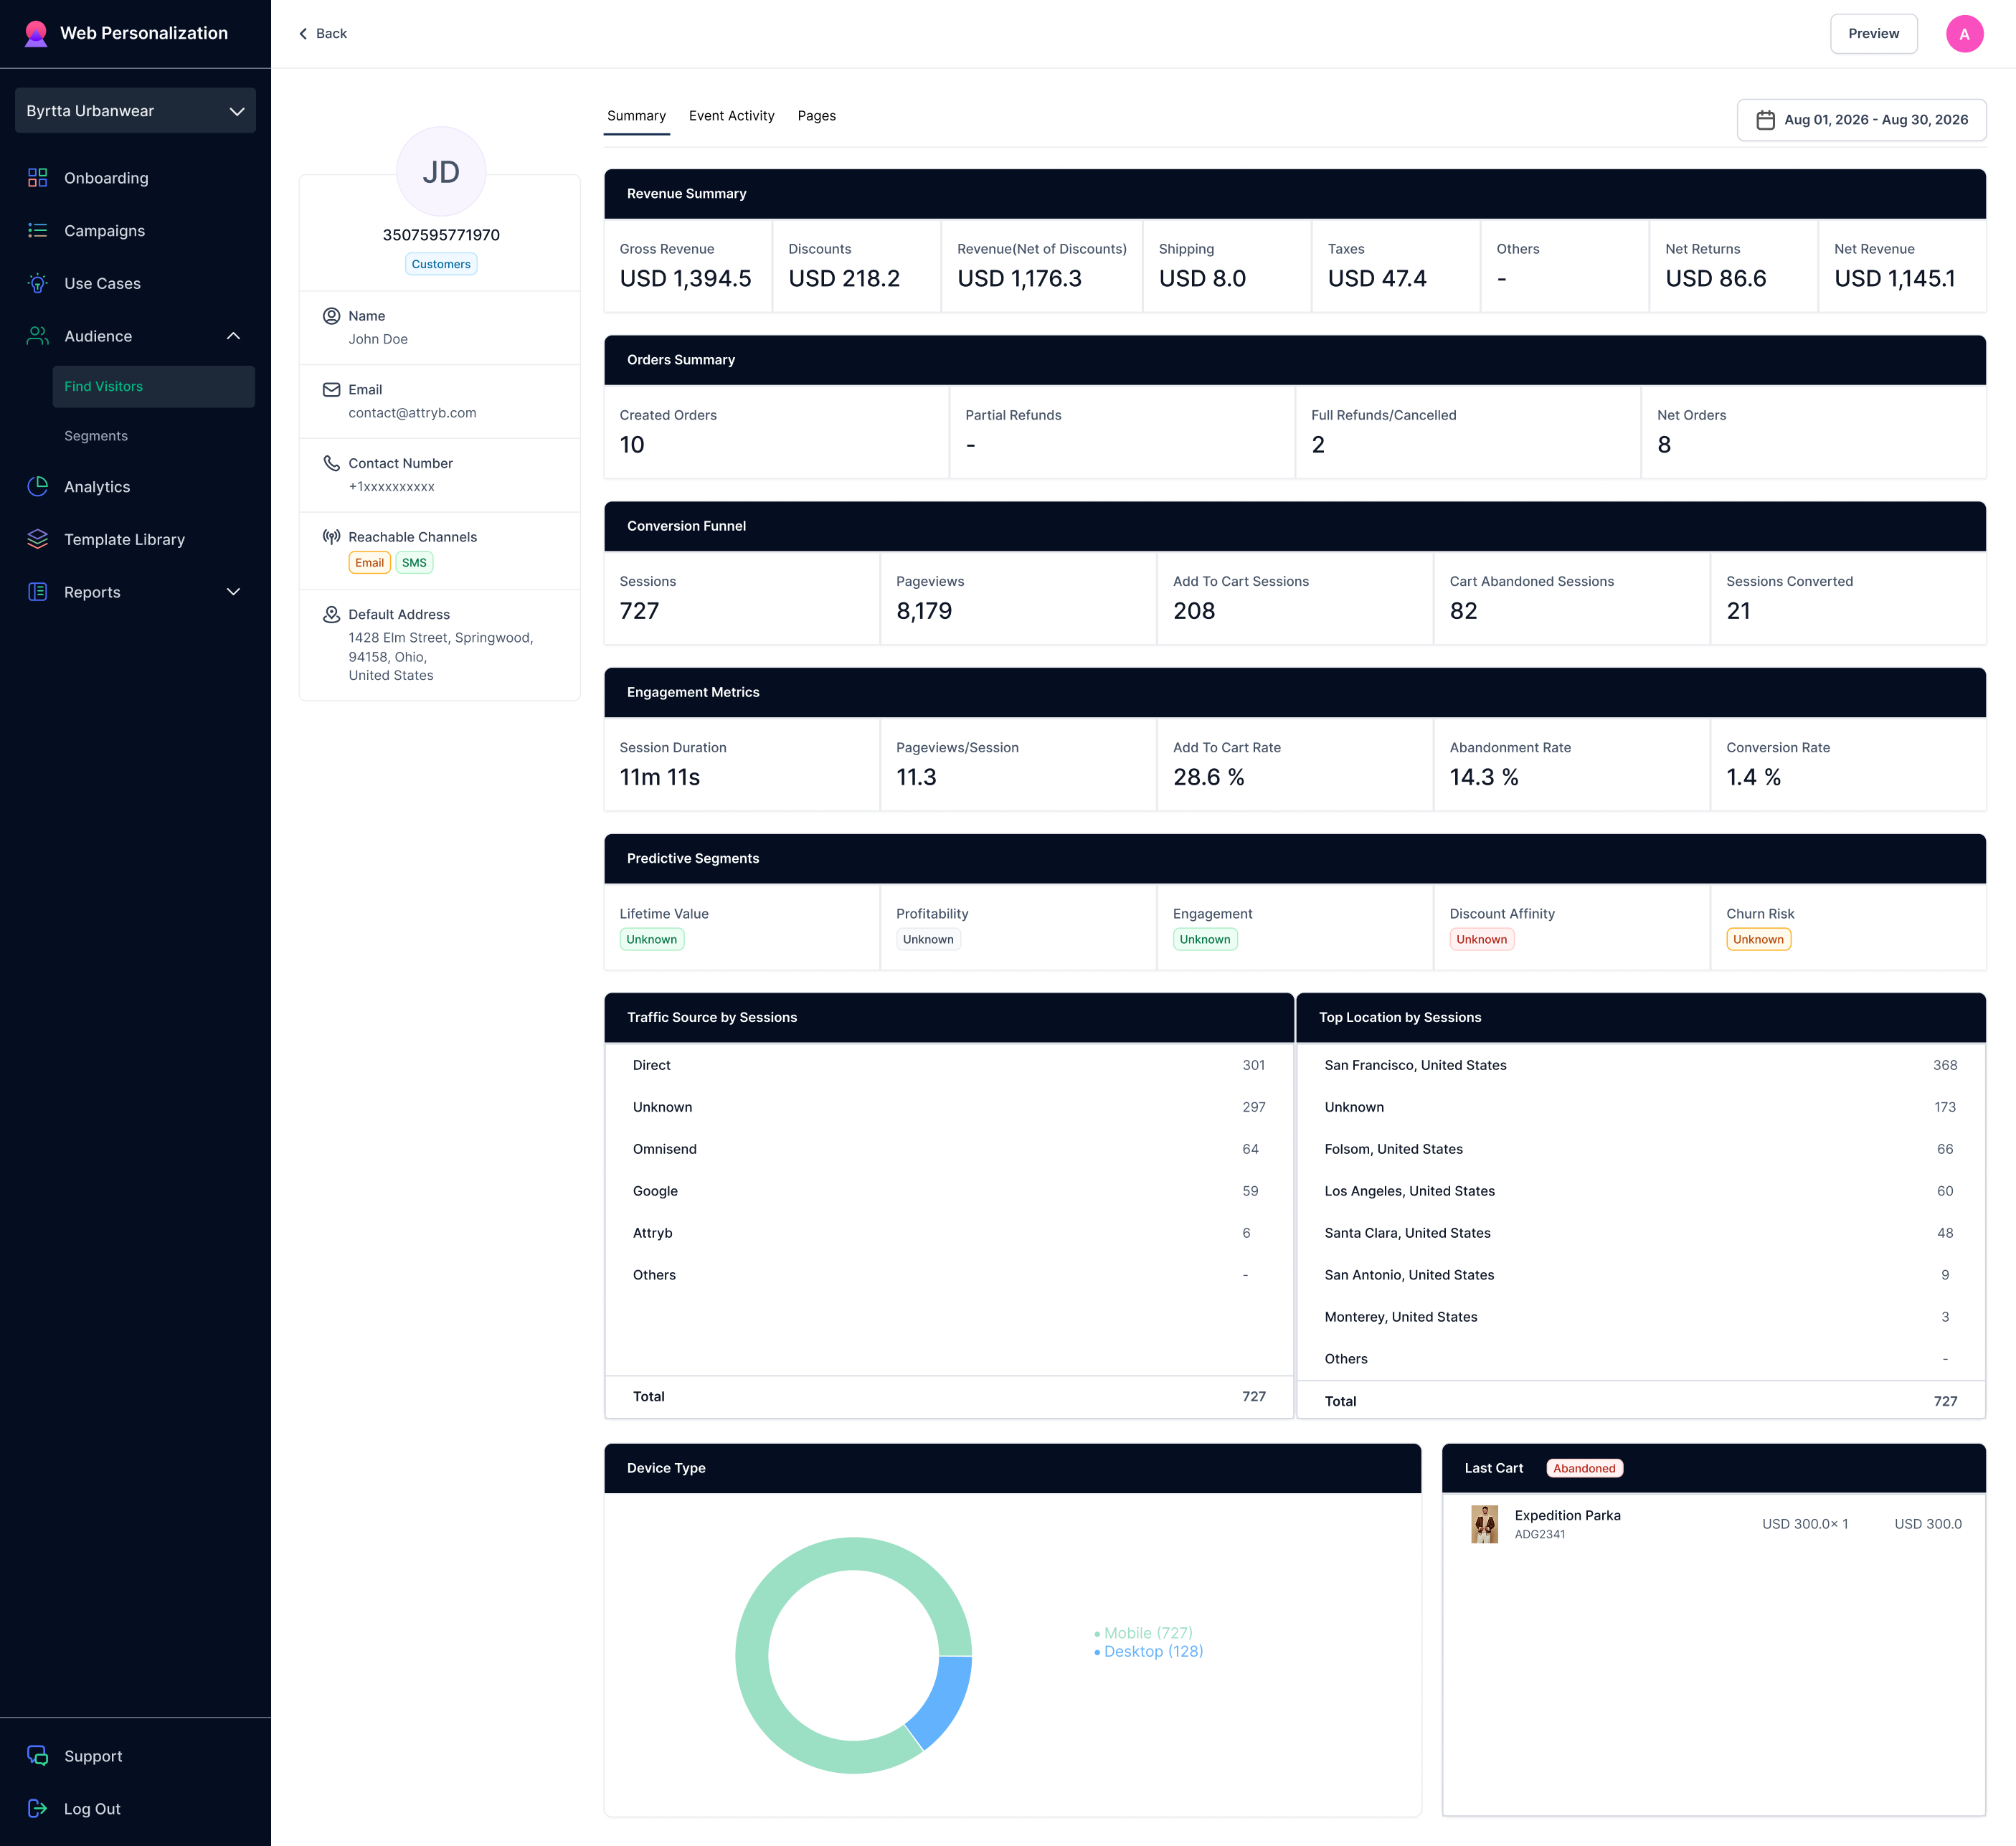
Attryb Personalize Visitor Summary page
Revenue Summary
What this visitor has been worth to you.
| Metric | What it means |
|---|---|
| Gross Revenue | What they paid, before anything is taken off |
| Discounts | Discounts applied to their orders |
| Revenue (Net of Discounts) | Gross revenue minus discounts |
| Shipping | Shipping they paid |
| Taxes | Tax collected on their orders |
| Others | |
| Net Returns | Value of what they sent back |
| Net Revenue | What you actually kept |
A dash means there is nothing to show for that metric in this date range.
NoteThese numbers can go negative. If a visitor returned an order during the period but did not buy anything new, the refund is counted with nothing to offset it.
Orders Summary
| Metric | What it means |
|---|---|
| Created Orders | Orders they placed |
| Partial Refunds | Orders where part of the value was refunded |
| Full Refunds/Cancelled | Orders refunded in full, or cancelled |
| Net Orders | Orders left after refunds and cancellations |
Conversion Funnel
How far the visitor got. These are counted in sessions, not pageviews.
| Metric | What it means |
|---|---|
| Sessions | Visits in this date range |
| Pageviews | Pages they opened across those sessions |
| Add To Cart Sessions | Sessions where they put something in the cart |
| Cart Abandoned Sessions | Sessions where they added to cart and left without buying |
| Sessions Converted | Sessions that ended in an order |
Read down the list and you can see where this visitor drops off.
Engagement Metrics
The same behaviour, shown as rates instead of counts.
| Metric | What it means |
|---|---|
| Session Duration | Average length of a session |
| Pageviews/Session | Average pages opened per session |
| Add To Cart Rate | Share of sessions where they added to cart |
| Abandonment Rate | Share of add-to-cart sessions that ended without an order |
| Conversion Rate | Share of sessions that ended in an order |
Predictive Segments
Five scores Attryb works out from the visitor's behaviour.
- Lifetime Value: what they are likely to be worth over time
- Profitability: how profitable their orders are
- Engagement: how actively they use your store
- Discount Affinity: how much they rely on a discount before they buy
- Churn Risk: how likely they are to stop buying
Each shows a level rather than a raw number. A score reads Unknown when there is not enough activity yet to judge.
Traffic Source by Sessions
Where this visitor's sessions came from: Google, an email tool, paid social, and so on. Each source has a session count, with a total at the bottom.
Use it to see which channel keeps bringing this person back.
Top Location by Sessions
The cities their sessions came from, with a count for each. Sessions Attryb cannot place show as Unknown.
Device Type
A donut chart of their sessions by device: mobile, desktop, or tablet.
Last Cart
What was in their cart the last time they had one. The badge next to the heading says whether that cart was empty or not.
Each line shows the product name, its SKU, the quantity, and the price.
Check this block before you contact someone about an abandoned cart.
Updated about 1 month ago