

Campaign performance
There are four levels of detail, depending on the question you are asking.
| Question | Where to look |
|---|---|
| How is everything doing? | The cards on the Campaigns screen |
| Which campaigns are working? | The table on the Campaigns screen |
| Which group of people is worth most? | The Segments screen |
| Which offer worked better? | The variant list inside a campaign |
The same four measures appear on all of them, so you can move between views without relearning anything.
The metrics
The same four measures appear at every level.
| Metric | What it counts |
|---|---|
| Sessions | Visits where the element was eligible to show |
| Impressions | Times the element was actually shown |
| Clicks | Times someone clicked it |
| Conversions | Purchases that followed |
| Conversion Rate | Conversions as a share of what was shown |
| Assisted Revenue | Revenue credited to this campaign |
Impressions are usually higher than sessions, because one person can see an element more than once in a visit. If impressions are far above sessions, check your frequency capping. You may be showing it too often.
NoteOnly elements a visitor can click record clicks, conversions and assisted revenue. Elements that are there to be read rather than clicked, like trust badges and informational banners, record impressions only. Dashes in those columns are normal for them, not a tracking problem.
For how revenue is credited, see Revenue attribution.
Everything at once
The four cards at the top of the Campaigns screen cover every campaign that matches your current filters and date range.
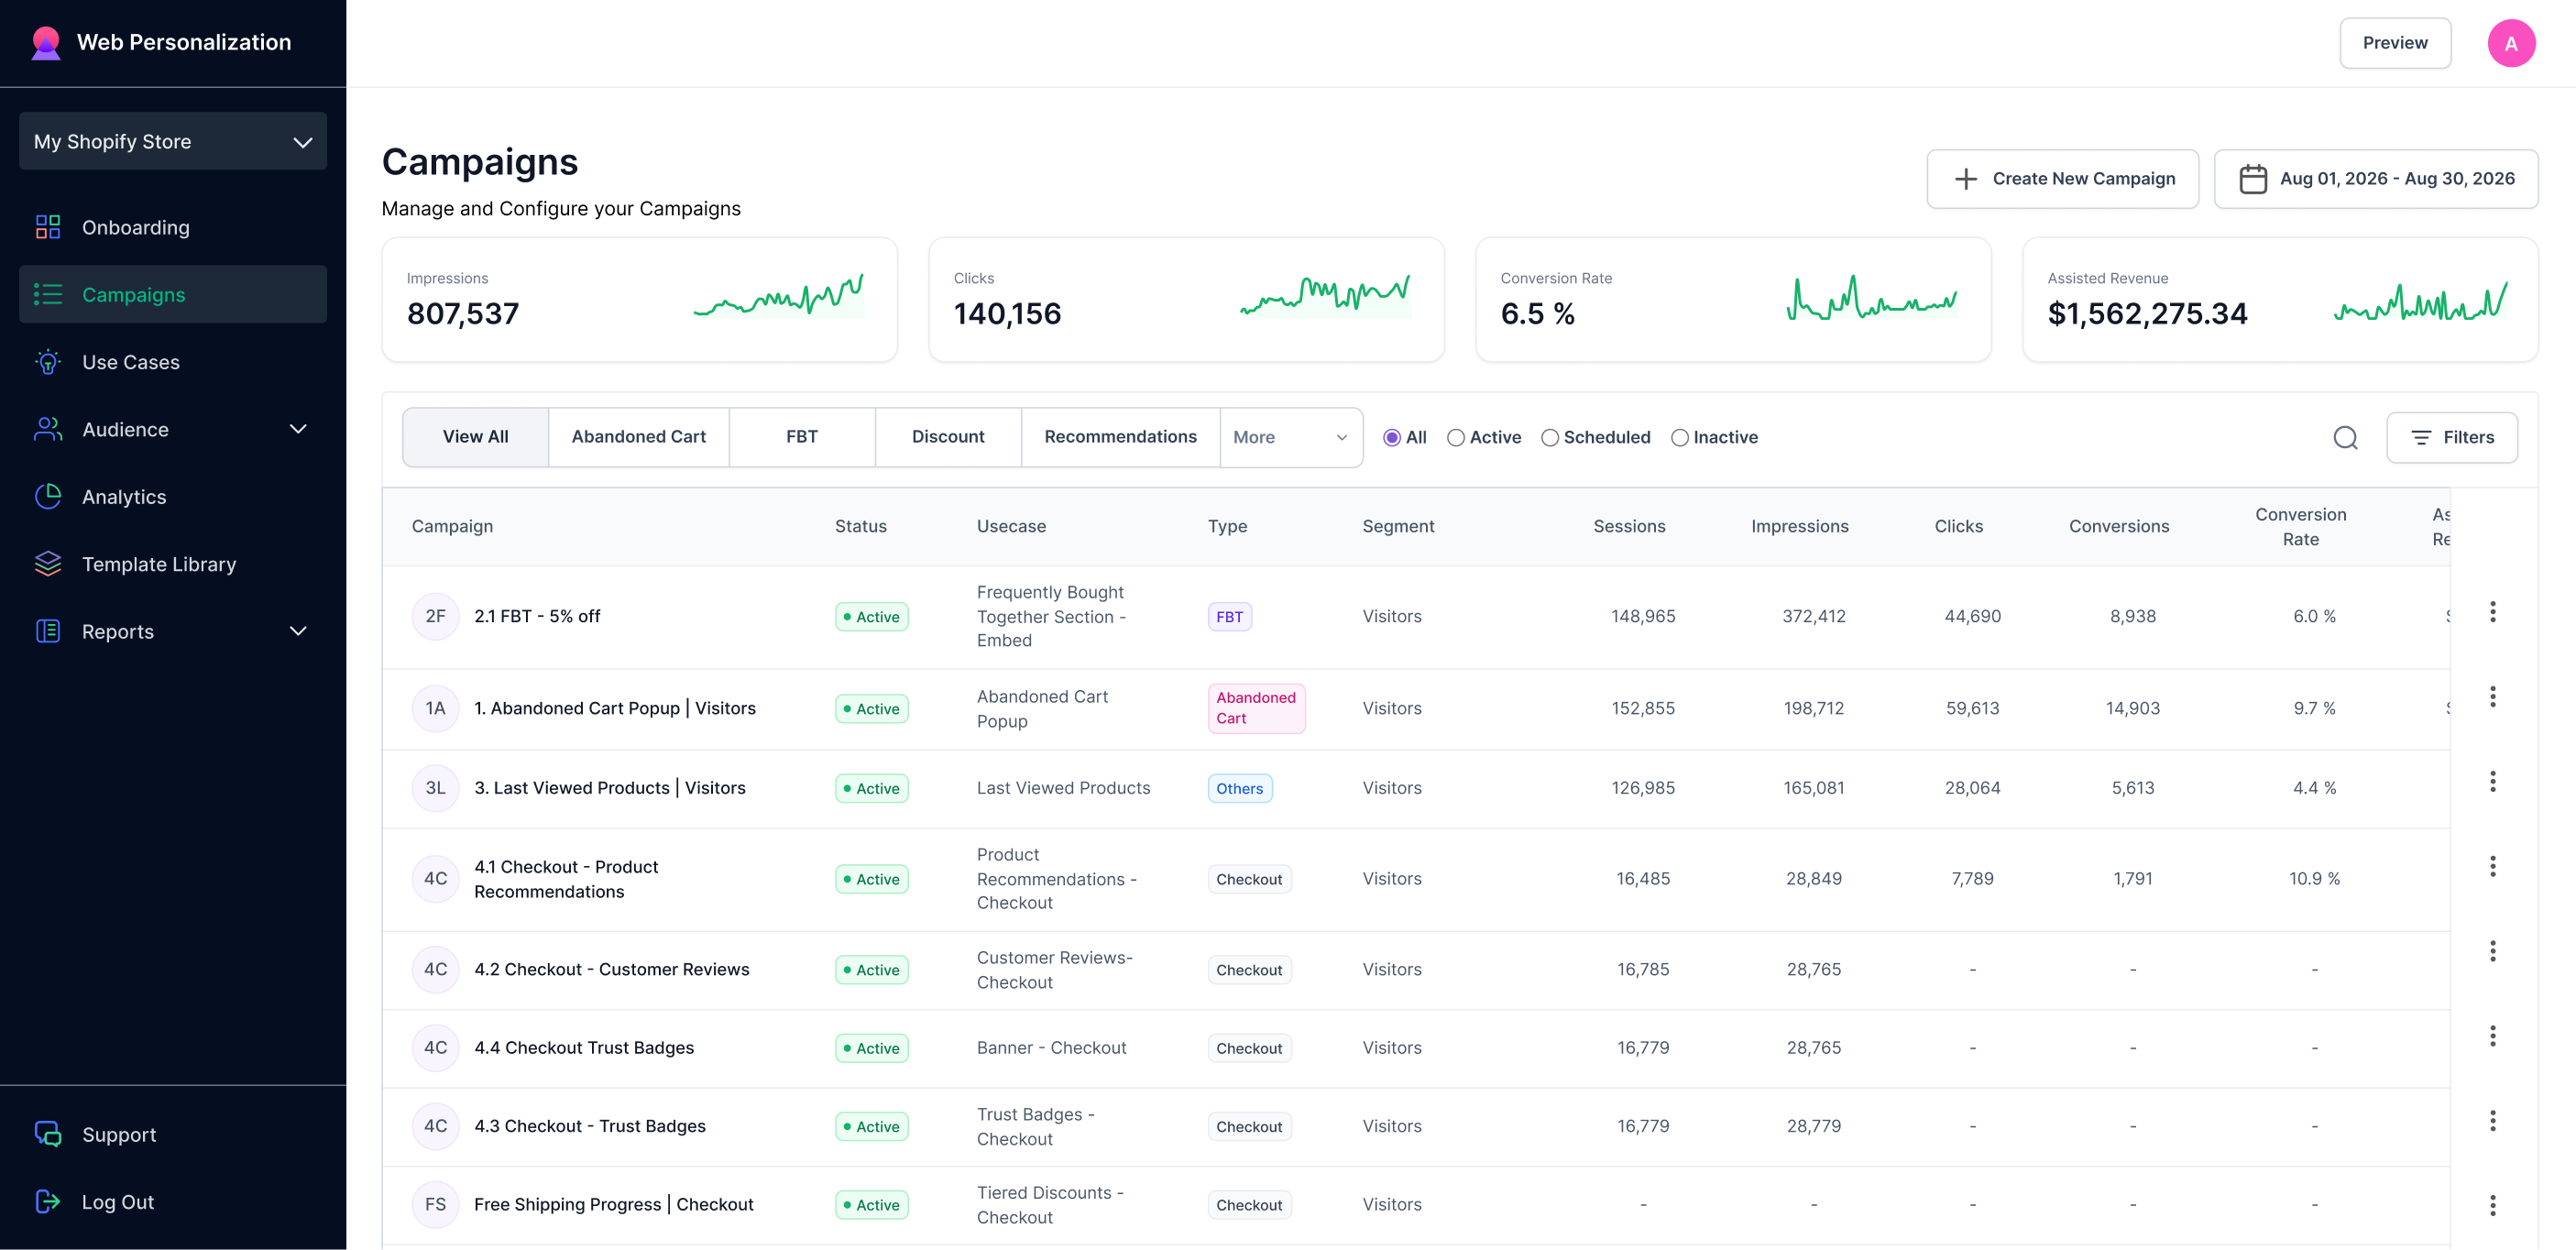
Campaign screen showing campaign-level performance and store-level metrics
Change a filter or the date range, and the cards change with it. Each card has a trend line, so you can see whether a number is climbing or falling without opening anything.
Campaign by campaign
The table below the cards gives you a row per campaign: its status, use case, type, segment, and its numbers through to assisted revenue.
This is the view for spotting the ones that are not working. A campaign with impressions but no clicks is being seen and ignored, usually because of the offer or the wording. A campaign with no impressions at all is not firing, which is almost always the trigger.
Because a campaign is one use case shown to one segment, two rows can share a use case and differ only in who sees it. An abandoned cart popup for all visitors and the same popup for first-time visitors are separate rows with separate numbers, which is exactly what you want when comparing them.
Segment by segment
The Audience → Segments screen carries the same four cards and a row per segment, so you can see which groups of people are producing the revenue rather than which campaigns are.
Segments with no live campaign show dashes. That is not a gap in tracking, it just means nothing is running against them yet.
Open a segment for its campaigns, its aggregate numbers, and the people in it. See View a segment.
Variant by variant
Open a campaign to see its variants, each with its own numbers.
This is where you compare offers. A variant that ran a 5% discount last month and one that ran 10% before that both keep their numbers, so you can look back at what each did.
Read those comparisons carefully. Only one variant runs at a time, so two variants never faced the same traffic. A variant that ran through a sale week will look better than one that ran in a quiet week whatever the offer was. Compare conversion rate rather than totals, and check the date ranges before drawing a conclusion.
Campaign Report
For a fuller report on a single campaign, open the three-dot menu on its row in the Campaigns list and choose Campaign Report.
Date range
Every screen here has a date picker at the top right, and every number on the screen obeys it.
A campaign that started last week shows nothing if your range covers last month. When a number looks wrong, check the range first.
Updated about 1 month ago